From Gateway to Dashboard Building an End-to-End Monitoring System

From Gateway to Dashboard: Building an End-to-End Monitoring System

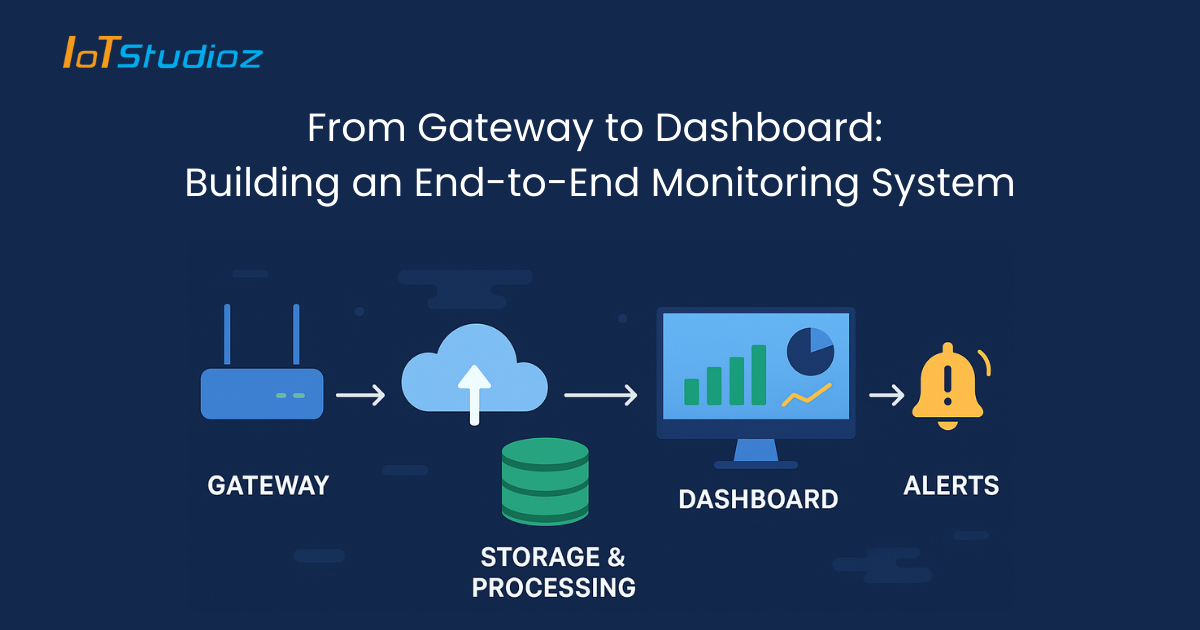
Modern businesses and industries run on data. From factories monitoring machine health to IT teams tracking server performance, real-time visibility is no longer optional; it’s essential. An end-to-end monitoring system ensures that data flows seamlessly from devices and gateways to the final dashboards where decision-makers can act.

But building such a system is not simple. It requires careful integration of hardware, communication protocols, cloud systems, databases, and visualization platforms. Done correctly, it helps organizations detect anomalies, improve efficiency, prevent downtime, and gain valuable insights.

1. Understanding the Concept of End-to-End Monitoring

End-to-end monitoring means tracking the entire data lifecycle from the moment data is generated to the point where it drives business action.

  • Data Origin: Sensors, devices, or applications generate raw information (temperature, pressure, CPU usage, network traffic, etc.).
  • Data Collection: Gateways collect and preprocess information before sending it further.
  • Transmission: Data moves securely via protocols (MQTT, HTTPS, LoRaWAN).
  • Storage and Processing: Systems organize and process data for analysis.
  • Visualization: Dashboards display insights in user-friendly formats.

The goal is to eliminate blind spots and create a transparent system where every stakeholder from technicians to executives can monitor performance.

2. The Role of IoT Gateways

Gateways are the first checkpoint in monitoring systems. They connect physical devices to digital networks and manage data flow.

Key functions of gateways include:

  • Protocol Translation: Converting legacy or industry-specific protocols (like Modbus, Zigbee, BACnet) into internet-ready formats (MQTT, HTTP).
  • Data Filtering: Removing unnecessary or duplicate information to save bandwidth.
  • Edge Processing: Performing calculations locally (e.g., detecting a machine anomaly) before sending data to the cloud.
  • Data Buffering: Storing data temporarily during network outages to prevent loss.
  • Device Management: Enabling remote configuration and firmware updates for connected devices.

Example: In a smart factory, a gateway collects temperature readings from multiple sensors, filters noise, and sends only relevant trends to the cloud reducing latency and bandwidth costs.

3. Data Transmission and Security

Once gateways process data, the next step is secure and reliable transmission to storage or cloud platforms.

  • Protocols:
    • MQTT for lightweight IoT communication
    • CoAP for constrained devices
    • HTTPS/WebSockets for cloud applications
  • Encryption: SSL/TLS ensures data cannot be intercepted or modified during transmission.
  • Redundancy: Secondary communication paths prevent downtime during network failures.
  • Scalability: Systems must handle thousands of devices without bottlenecks.

Without strong transmission mechanisms, monitoring systems risk delays, data loss, or even cyberattacks that could cripple operations.

4. Data Storage and Processing Layer

Raw data is only valuable when structured and analyzed. The storage layer ensures information is organized, retrievable, and ready for real-time and historical analysis.

  • Time-Series Databases: (e.g., InfluxDB, TimescaleDB) store metrics with timestamps for continuous monitoring.
  • Data Warehouses & Lakes: (e.g., Snowflake, AWS Redshift, Azure Data Lake) keep large-scale historical data for reporting and analytics.
  • Stream Processing: Kafka, Apache Flink, or Spark process events in real-time for instant alerts.
  • Normalization & Aggregation: Ensures data is standardized, reducing inconsistencies.

Example: In logistics, a fleet monitoring system aggregates fuel consumption, driver behavior, and GPS data to optimize routes and reduce costs.

5. Building the Dashboard

The dashboard is the user-facing layer of monitoring systems, the point where data turns into actionable insights.

A good dashboard should provide:

  • Real-Time Visualization: Graphs, charts, and maps that update instantly.
  • Custom Views: Role-based dashboards for technicians, managers, and executives.
  • Drill-Down Analysis: Ability to move from high-level KPIs to detailed logs.
  • Alert Management: Highlighting anomalies and sending notifications.
  • Cross-Device Accessibility: Web, desktop, and mobile support.

Tools like Grafana, Power BI, Kibana, or custom web apps are commonly used. A well-designed dashboard prevents information overload and keeps focus on what truly matters.

6. Challenges in Building an End-to-End Monitoring System

Creating a complete monitoring solution is complex, with several challenges:

  • Data Silos: Different systems may not communicate, causing fragmented views.
  • Scalability Issues: Adding more devices may overwhelm infrastructure.
  • Latency Problems: Delayed data transmission reduces system responsiveness.
  • Cybersecurity Risks: Gateways and dashboards are prime targets for hackers.
  • User Adoption: Complex dashboards discourage usage and reduce ROI.

Organizations must address these early to avoid system inefficiencies.

7. Best Practices for Success

To build a reliable and scalable monitoring system, businesses should:

  • Standardize Protocols: Ensure all devices follow common communication standards.
  • Adopt Edge Intelligence: Process data at the gateway to minimize delays.
  • Choose Scalable Cloud Solutions: Prepare for exponential data growth.
  • Strengthen Cybersecurity: Encrypt data, use firewalls, and enable RBAC/ABAC access.
  • Focus on User-Centric Design: Keep dashboards simple, intuitive, and goal-oriented.

These practices help create a system that evolves with business needs.

8. Real-World Applications

Monitoring systems are industry-agnostic and apply across multiple sectors:

  • Manufacturing: Machine health monitoring, predictive maintenance.
  • Smart Cities: Energy usage tracking, traffic flow monitoring, public safety.
  • Healthcare: Patient vitals monitoring via connected devices.
  • Logistics: Fleet tracking, fuel optimization, cold chain monitoring.
  • IT Infrastructure: Server uptime, application monitoring, cybersecurity alerts.

Example: In healthcare, wearable IoT devices send real-time patient vitals to dashboards that alert doctors instantly if anomalies are detected.

9. Automation and Alerting Mechanisms

Monitoring should move beyond observation to proactive action.

  • Threshold Alerts: Notify teams when conditions exceed safe limits (e.g., temperature crossing 80°C in machinery).
  • AI-Powered Anomaly Detection: Detects unusual patterns without fixed thresholds.
  • Automated Responses: Systems that can reboot servers, adjust HVAC systems, or reroute traffic automatically.
  • Multi-Channel Notifications: Alerts through SMS, email, mobile apps, or collaboration tools like Slack.

This ensures issues are resolved before they cause downtime or losses.

10. Integration with Analytics and Machine Learning

The real power of monitoring comes when combined with analytics and AI/ML models.

  • Predictive Maintenance: ML models forecast machine failures, reducing downtime.
  • Performance Optimization: Analyzing efficiency data to optimize operations.
  • Root Cause Analysis: Identifying why failures occur by analyzing historical patterns.
  • Business Intelligence: Combining operational data with sales or financial metrics for better decisions.

For instance, in smart manufacturing, integrating ML with monitoring can predict when a motor will fail and automatically schedule maintenance, saving costs and avoiding disruption.

Conclusion

Building an end-to-end monitoring system is not just about technology; it’s about creating a data-driven ecosystem that empowers decision-making. From gateways that collect and preprocess data to dashboards that visualize insights, each layer contributes to system reliability and efficiency.

When paired with automation, AI, and analytics, monitoring systems go beyond just tracking performance; they enable predictive, proactive, and intelligent operations.

Companies that invest in robust monitoring infrastructures not only reduce risks but also position themselves for long-term innovation and growth.

FAQs

1. What is an end-to-end monitoring system?

An end-to-end monitoring system tracks data throughout its lifecycle from the moment it’s generated by sensors or devices, through gateways and storage systems, and finally to dashboards where it’s analyzed and visualized for decision-making.

2. Why are IoT gateways important in monitoring systems?

IoT Gateways act as intermediaries between devices and the cloud. They handle protocol translation, preprocess data to reduce noise, ensure data buffering during outages, and sometimes provide local intelligence for faster insights.

3. How does data security fit into monitoring systems?

Security is crucial at every stage. Data is encrypted during transmission, stored securely in databases or clouds, and access is controlled using authentication and role-based policies to prevent unauthorized access.

4. Which industries benefit most from monitoring systems?

Industries like manufacturing, healthcare, logistics, IT infrastructure, and smart cities benefit significantly. These systems help monitor equipment health, track assets, manage patient care, and ensure uptime of critical systems.

5. What’s the difference between monitoring and analytics?

Monitoring focuses on real-time visibility knowing what’s happening now while analytics digs deeper into historical data to find patterns, optimize performance, and predict future outcomes. When combined, they provide a powerful decision-making framework.